Image Details
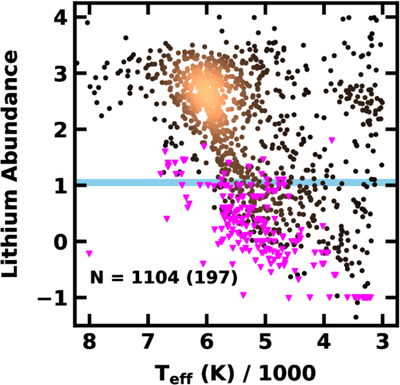
Caption: Figure 12.
Lithium abundance A(Li) as a function of effective temperature for CDDS stars. Colors of filled circles (1104 points) indicate the relative density, ranging from low (black) to moderate (dark gold) to high (bright yellow). Filled fuchsia triangles indicate upper limits for 197 stars. The solid horizontal blue line indicates the solar lithium abundance (M. Asplund et al. 2009). CDDS stars follow the general trend of decreasing A(Li) with decreasing Teff, but they display a clear gap at 1.0 ≲ A(Li) ≲ 2.0 not observed in much larger samples.
Other Images in This Article
Show More
Copyright and Terms & Conditions
© 2026. The Author(s). Published by the American Astronomical Society.
Copyright ©
2026 Astronomy Image Explorer. All Rights Reserved.