Image Details
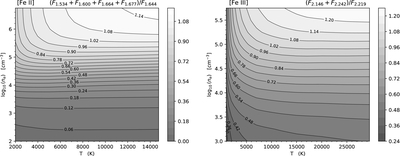
Caption: Figure 8.
Shaded contour plots for our [Fe II] and [Fe III] density diagnostics showing the diagnostic ratio values from Equations (2) and (3) as a function of the gas temperature and density.
Other Images in This Article
Copyright and Terms & Conditions
© 2026. The Author(s). Published by the American Astronomical Society.
Copyright ©
2026 Astronomy Image Explorer. All Rights Reserved.