Image Details
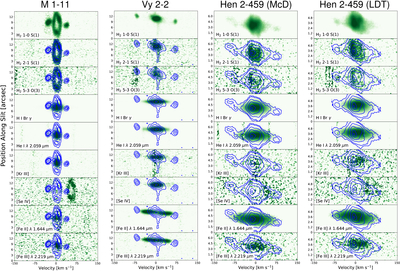
Caption: Figure 2.
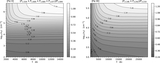
Position–velocity diagrams of selected H2, H I, He I, [Kr III], [Se IV], [Fe II], and [Fe III] lines for M 1-11 (far left), Vy 2-2 (middle left), Hen 2-459 McD (middle right), and Hen 2-459 LDT (far right) observations. The H2 1–0 S(1) line from the top is overplotted over all the other lines as blue contours to facilitate direct comparison of the emission from H2 and other species. The x-axis shows the velocity in kilometers per second relative to the nebular center, and the y-axis shows the spatial position along the slit with the orientation shown in Figure 1. Note that the H2 3-2 S(2) line is ∼50 km s−1 redward of the position of the undetected [Se IV] line in the M 1-11 PV diagram.
Other Images in This Article
Copyright and Terms & Conditions
© 2026. The Author(s). Published by the American Astronomical Society.