Image Details
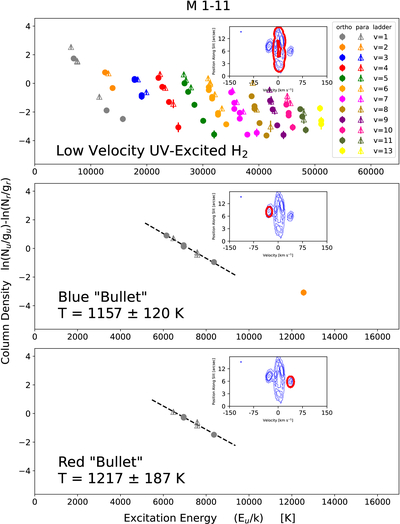
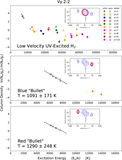
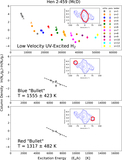
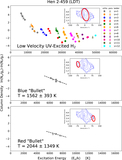
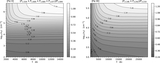
Caption: Figure 4.
H2 excitation diagrams for M 1-11. The thumbnail PV diagrams show the 1–0 S(1) line and the aperture used to extract each H2 component. The dashed lines show the least-squares linear regression fits to the H2 level populations of each thermal bullet, from which their temperatures are derived.
Other Images in This Article
Copyright and Terms & Conditions
© 2026. The Author(s). Published by the American Astronomical Society.
Copyright ©
2026 Astronomy Image Explorer. All Rights Reserved.