Image Details
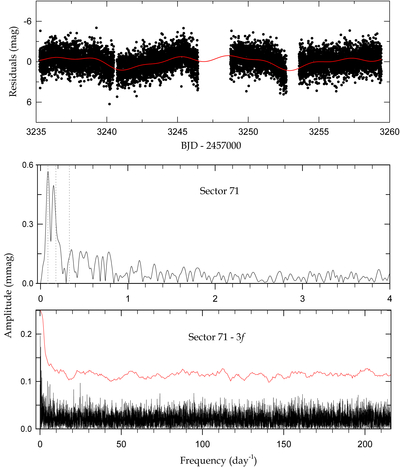
Caption: Figure 5.
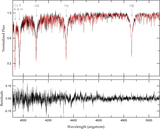
The top panel shows the light curve residuals of TESS S71 distributed in BJD. The middle and bottom panels are amplitude spectra before and after prewhitening all three frequencies extracted from the full residuals using the PERIOD04 code. The synthetic model curve for these frequencies is indicated by the red solid line in the top panel. The vertical dotted lines in the middle panel indicate the positions of the extracted frequencies and the red line in the bottom panel represents five times the noise spectrum.
Other Images in This Article
Copyright and Terms & Conditions
© 2026. The Author(s). Published by the American Astronomical Society.
Copyright ©
2026 Astronomy Image Explorer. All Rights Reserved.