Image Details
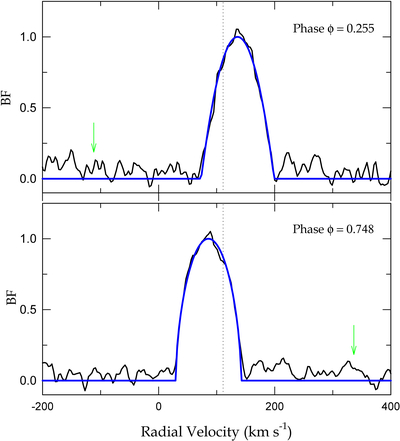
Caption: Figure 2.
Sample of the BF profiles. The black lines are the observed BFs for two orbital phases (ϕ), with a single peak representing the primary component. A rotational broadening function applied to this peak is plotted as the solid blue line. The vertical dotted lines represent the radial velocity of the binary center of mass, and the green arrows point to the RV positions of the secondary companion predicted by our binary modeling.
Other Images in This Article
Copyright and Terms & Conditions
© 2026. The Author(s). Published by the American Astronomical Society.
Copyright ©
2026 Astronomy Image Explorer. All Rights Reserved.