Image Details
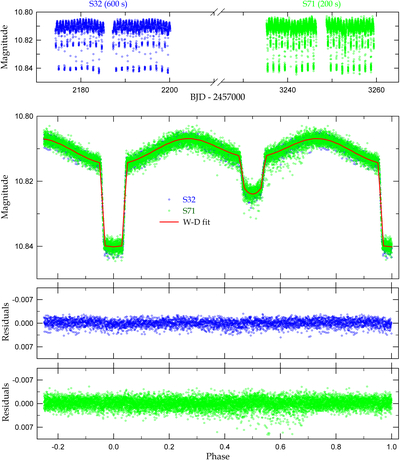
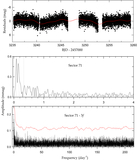
Caption: Figure 1.
TESS observations of TIC 399725538 distributed in BJD (top panel) and orbital phase (second panel). The blue and green circles are individual measurements for Sectors 32 and 71, respectively, and the red solid curve represents the synthetic model obtained through our Wilson–Devinney (W-D) fit. The third and bottom panels show the residual lights corresponding to the binary model curve.
Other Images in This Article
Copyright and Terms & Conditions
© 2026. The Author(s). Published by the American Astronomical Society.
Copyright ©
2026 Astronomy Image Explorer. All Rights Reserved.