Image Details
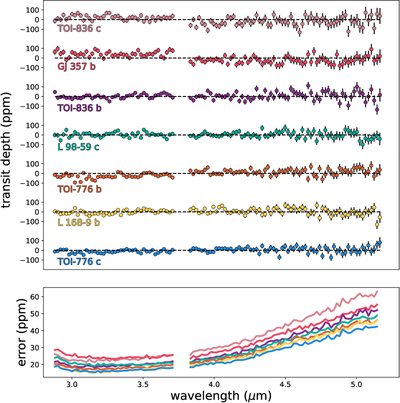
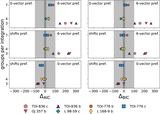
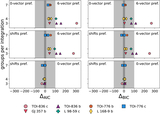
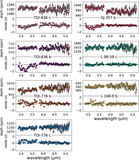
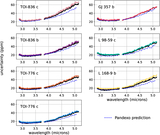
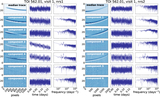
Caption: Figure 8.
Top panel: spectra for each planet in the sample after subtracting off the mean to make it easier to visualize the amplitude of the scatter. No attempt has been made to correct for offsets between detectors. Bottom panel: error on transit depth measurements in ppm. For GJ 357 b, TOI-836 b, and TOI-836 c, these are the spectra obtained using the 6-vector systematics model, while for TOI-776 b, TOI-776 c, L 98–59 c, and L 168–9 b, these are the spectra obtained with the trend-only systematics model corresponding to the red points in Figure 6.
Other Images in This Article
Show More
Copyright and Terms & Conditions
© 2026. The Author(s). Published by the American Astronomical Society.
Copyright ©
2026 Astronomy Image Explorer. All Rights Reserved.