Image Details
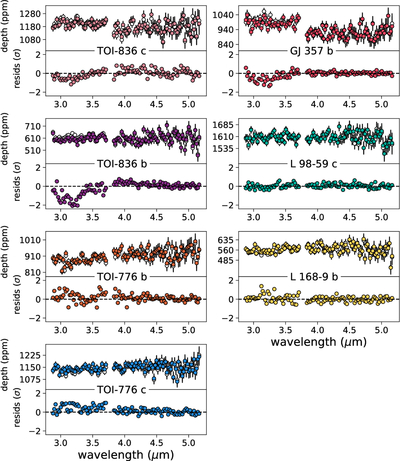
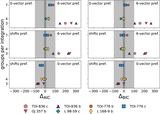
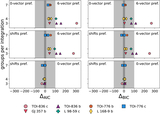
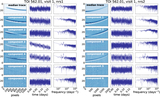
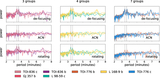
Caption: Figure 6.
Comparison between spectra produced with the 0-vector systematics model (white points) and the 6-vector systematics model described above (colored points). The top panel shows the two spectra, and the bottom panel shows the residuals between them. For subsequent modeling and analysis, we have elected to use the spectra corresponding to the 6-vector systematics model for GJ 357 b and TOI-836 b and c, all of which were observed with three groups and all of which show a systematic offset with respect to the other spectra between 3.0 and 3.5 μm. For all other targets, we use the spectra corresponding to the 0-vector systematics model.
Other Images in This Article
Show More
Copyright and Terms & Conditions
© 2026. The Author(s). Published by the American Astronomical Society.