Image Details
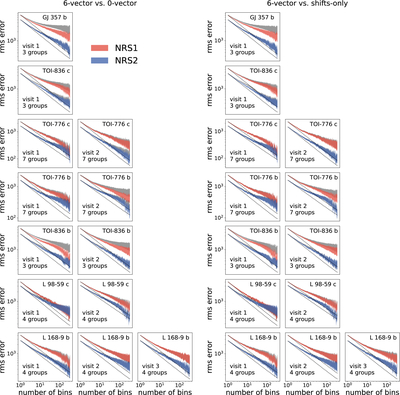
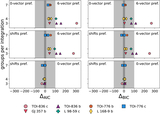
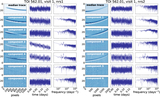
Caption: Figure 3.
Shown here are rms vs. bin-size for the residuals to the white light curves after subtraction of the maximum-likelihood transit + systematics model for both detectors and all visits of the seven planets in our sample. Left panels: comparison between the 6-vector model (red and blue shaded regions) and the 0-vector model (gray shaded regions). Right panels: comparison between the 6-vector model (red and blue shaded regions) and the shifts-only model (gray shaded regions). While some degree of red noise remains for all of the datasets, the 6-vector systematics model is more effective at reducing the red noise than either alternative systematics model, particularly for the three-group observations.
Other Images in This Article
Show More
Copyright and Terms & Conditions
© 2026. The Author(s). Published by the American Astronomical Society.