Image Details
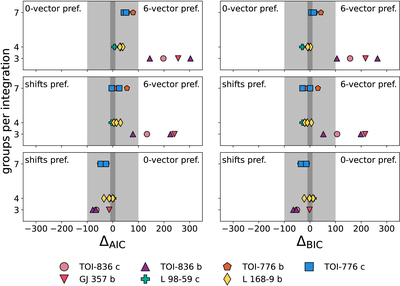
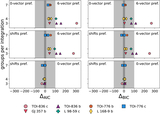
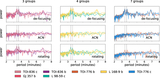
Caption: Figure 4.
ΔAIC (left) and ΔBIC (right) between each set of systematics models for the NRS1 detector, with each point representing a single visit of the target. The number of groups per integration for the observation is on the y-axis. The dark-gray shaded region indicates that there is no clear evidence for one model over the other. For observations falling in the light-gray region, there is strong evidence for the indicated model, and for observations falling in the unshaded region, there is decisive evidence for the indicated model. The thresholds for “strong” and “decisive” evidence are taken from A. E. Raftery (1995).
Other Images in This Article
Show More
Copyright and Terms & Conditions
© 2026. The Author(s). Published by the American Astronomical Society.