Image Details
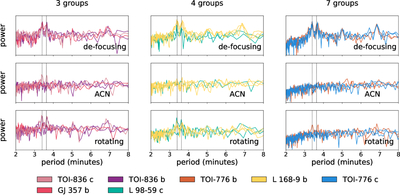
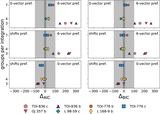
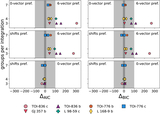
Caption: Figure 10.
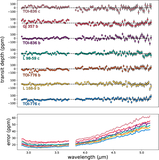
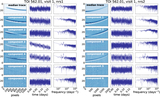
Superimposed power spectra for the principal components of the NRS1 RPF time series for all visits separated by three-group observations (left), four-group observations (middle), and seven-group observations (right). The most prominent peaks in the power spectra are identified with vertical dashed lines at 3.4 and 3.6 minutes. These peaks do not appear in observation. The colors map to the colors for each planet’s spectrum shown in Figure 8.
Other Images in This Article
Show More
Copyright and Terms & Conditions
© 2026. The Author(s). Published by the American Astronomical Society.
Copyright ©
2026 Astronomy Image Explorer. All Rights Reserved.