Image Details
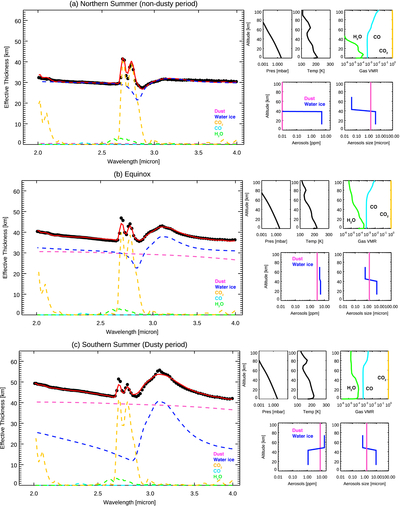
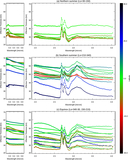
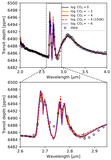
Caption: Figure 6.
A comparison between the empirical transit spectra of Mars, derived from TGO/NOMAD solar occultation measurements, and synthetic spectra calculated using PSG—based on a single representative atmospheric structure—is presented in the left panels for the northern summer period (a), equinox period (b), and southern summer period (c). The black curves represent the empirical transit spectra, the red curves correspond to the PSG synthetic spectra, and the other colors indicate the individual spectral contributions. The right panels show the assumed vertical profiles of pressure, temperature, gas mixing ratios (H2O, CO, and CO2), aerosol properties (dust and H2O ice clouds), and aerosol particle sizes.
Other Images in This Article
Copyright and Terms & Conditions
© 2026. The Author(s). Published by the American Astronomical Society.