Image Details
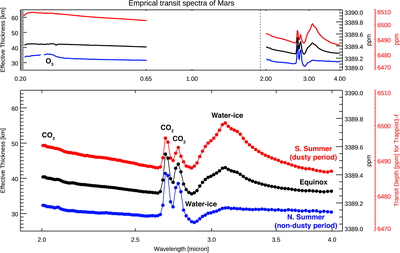
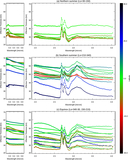
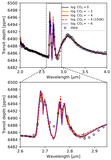
Caption: Figure 5.
Empirical transit spectra of Mars derived from TGO/NOMAD measurements are shown for the northern summer period (blue curve), equinox period (black curve), and southern summer period (red curve). The right y-axis indicates the transit depth for Mars (black axis), scaled to represent the case of TRAPPIST-1f.
Other Images in This Article
Copyright and Terms & Conditions
© 2026. The Author(s). Published by the American Astronomical Society.
Copyright ©
2026 Astronomy Image Explorer. All Rights Reserved.