Image Details
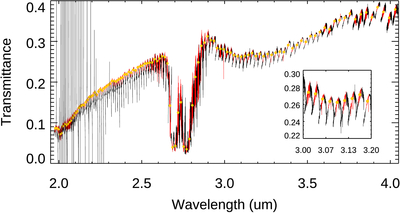
Caption: Figure 1.
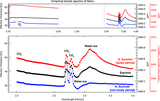
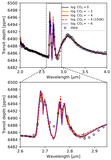
An example of spectra obtained by NOMAD/SO in full-scan mode. The spectra were taken between 19.86 km and 22.43 km above the surface of Mars. The red curves indicate the central 120 pixels of each spectrum, which are averaged to produce empirical spectra with low spectral resolution. The averaged transmittances for each diffraction order are shown as orange dots. The inset at the lower right shows a zoomed-in view of the 3.0–3.2 μm region.
Other Images in This Article
Copyright and Terms & Conditions
© 2026. The Author(s). Published by the American Astronomical Society.
Copyright ©
2026 Astronomy Image Explorer. All Rights Reserved.