Image Details
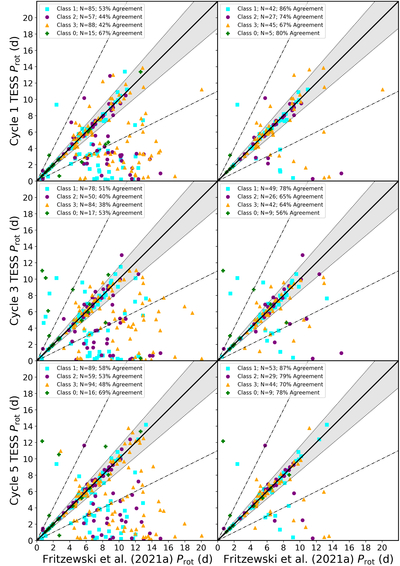
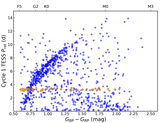
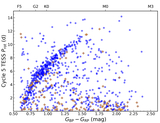
Caption: Figure 12.
Comparisons of the Prot measured using TESS light curves from Cycles 1, 3, and 5 with those from D. J. Fritzewski et al. (2021a), before (left) and after (right) our analysis removing our erroneous measurements. The shaded region indicates a difference of ≤15% between the TESS and literature Prot values, which we take to be an agreement in the measurements. We also include 2:1 and 1:2 lines to indicate possible harmonic or subharmonic measurements. The classification assigned to each Prot measurement in D. J. Fritzewski et al. (2021a) is indicated with a different symbol. Even before analyzing our results, we have a high Prot recovery rate (50%–60%) for the high-confidence (class 1) measurements from D. J. Fritzewski et al. (2021a), shown as filled cyan squares. Our initial agreement rate for lower-confidence measurements—especially those obtained using activity as a prior (class 3; filled orange triangles)—is systematically lower (≈40%–50%). Our analysis of cases where our measurements differ significantly from those of D. J. Fritzewski et al. (2021a) allows us to improve our recovery rate, so that it reaches ≳80% for the class 1 Prot, while the other classes of Prot measurements saw slightly smaller improvements in agreement rate.
Other Images in This Article
Show More
Copyright and Terms & Conditions
© 2026. The Author(s). Published by the American Astronomical Society.