Image Details
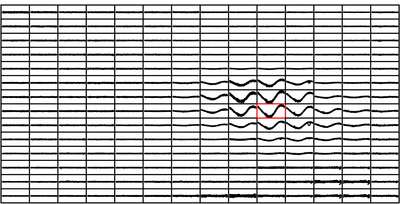
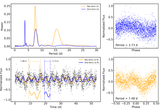
Caption: Figure 7.
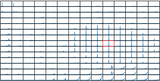
Light curves produced for each pixel in Figure 6 phase-folded on a period of 2.1 days, the period of the classical Cepheid Gaia DR3 5340164256296564736. The light curve for the pixel hosting the Cepheid is highlighted with a red frame. The 2.1 days signal is dominant in the light curve extracted from that pixel, as expected, but also in those extracted from many surrounding pixels. The y-axes of these plots share a flux scale, demonstrating the relative strength of the 2.1 days signal.
Other Images in This Article
Show More
Copyright and Terms & Conditions
© 2026. The Author(s). Published by the American Astronomical Society.
Copyright ©
2026 Astronomy Image Explorer. All Rights Reserved.