Image Details
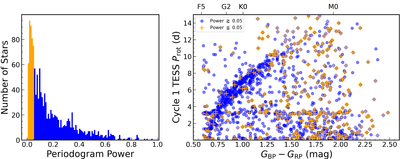
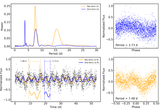
Caption: Figure 4.
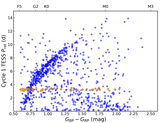
The impact on the Cycle 1 Prot distribution of requiring a minimum power when validating Prot measurements. The left panel shows a histogram of the periodogram powers for the Cycle 1 light curves; the orange bins correspond to powers below the 30th percentile for this dataset (0.05 in this case). The right panel shows the full distribution of Cycle 1 Prot, with the values drawn from measurements with a power below the 30th percentile indicated with orange crosses. Those low-power measurements include many outliers, such as the K stars with Prot > 10 days or <1 day, and other problematic measurements, such as the strip of ≈3 days Prot across the observed color range.
Other Images in This Article
Show More
Copyright and Terms & Conditions
© 2026. The Author(s). Published by the American Astronomical Society.