Image Details
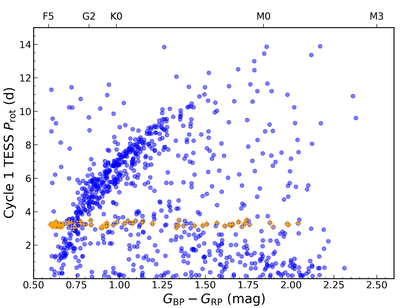
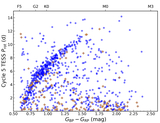
Caption: Figure 5.
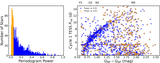
TESS Cycle 1 CPD depicting our identification of Prot measurements that are the result of systematic errors. Measurements of Prot < 15 days with periodograms powers greater than the 30th percentile power for this cycle are plotted as blue circles. Prot measurements ranging from 3.0 to 3.5 days with periodogram powers <0.1 are marked with orange crosses and are likely the result of an (unspecified) systematic error in the Cycle 1 data. Setting a Prot range and raising the minimum power required for consideration allows us to remove a number of unreliable measurements missed with the cut illustrated in Figure 4.
Other Images in This Article
Show More
Copyright and Terms & Conditions
© 2026. The Author(s). Published by the American Astronomical Society.