Image Details
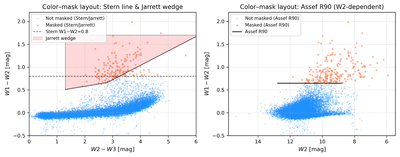
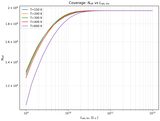
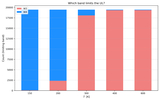
Caption: Figure 6.
Color–color diagrams and mask footprints. Left: W1 − W2 vs. W2 − W3 with points colored by retained (blue) vs. masked (orange) under the two masks. We overlay the Stern threshold W1 − W2 = 0.8 (horizontal dashed) and the Jarrett wedge boundaries (solid), shading only the domain where the wedge applies (W2 − W3 ≥ 1.3 and W1 − W2 ≤ 1.7). Right: W1 − W2 vs. W2 with the Assef R90 reliability cut, ﹩({\rm{W}}1-{\rm{W}}2)\,\geqslant \,{{ \mathcal R }}_{90}({\rm{W}}2)﹩, which is not representable on the left-hand plane. The union mask is the logical OR of these three criteria.
Other Images in This Article
Show More
Copyright and Terms & Conditions
© 2026. The Author(s). Published by the American Astronomical Society.
Copyright ©
2026 Astronomy Image Explorer. All Rights Reserved.