Image Details
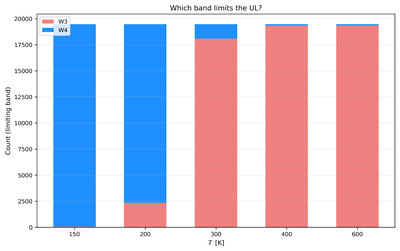
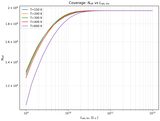
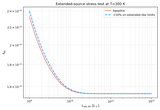
Caption: Figure 5.
Which band sets the tightest per object upper limit as a function of radiator temperature T. At T ≲ 200 K, W4 (22 μm) overwhelmingly limits; at T ≳ 300 K, W3 (12 μm) dominates, consistent with Wien’s law and band sensitivities. These statistics explain the shapes of Figure 2 and guide future observing strategy.
Other Images in This Article
Show More
Copyright and Terms & Conditions
© 2026. The Author(s). Published by the American Astronomical Society.
Copyright ©
2026 Astronomy Image Explorer. All Rights Reserved.