Image Details
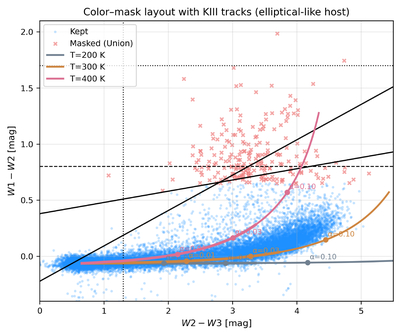
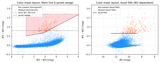
Caption: Figure 12.
WISE W1 − W2 vs. W2 − W3 (Vega) color–color diagram for the 2MRS cross matched galaxy sample, shown to visualize how our MIR AGN/starburst rejection interacts with plausible galaxy-scale waste heat (KIII) spectral energy distributions. Blue circles are galaxies retained for the analysis, while orange crosses are galaxies masked by the adopted MIR AGN/starburst criteria (union of the Stern, Assef R90, and Jarrett diagnostics; see Section 3.2). The black guide lines show the commonly used MIR selection boundaries: the Stern threshold W1 − W2 = 0.8 (horizontal dashed), and the Jarrett “wedge” boundaries (solid oblique lines) together with its additional limits W2 − W3 ≥ 1.3 and W1 − W2 ≤ 1.7 (vertical and horizontal dotted lines, respectively). Overplotted colored curves are illustrative KIII “tracks” for an elliptical-like (dust poor) host whose stellar MIR continuum is progressively supplemented by a single temperature waste heat blackbody at T = {200, 300, 400} K. The parameter α denotes the fractional waste heat luminosity in the AGENT sense (i.e., the fraction of the host’s bolometric power reprocessed and reradiated thermally as waste heat at temperature T), and labeled points mark representative values along each track. The tracks are curved (rather than straight vectors) because increasing α does not only raise the long-wavelength emission (driving redder W2 − W3), but at sufficiently large α it also alters the short wavelength bands: the stellar contribution to W1 and W2 is diluted/attenuated while the waste heat component can contribute nonnegligibly in W2 for warmer radiators, changing W1 − W2 and producing a non–linear trajectory in color space. This figure therefore provides a direct visual check of whether putative KIII-like SEDs would lie inside the AGN/starburst loci targeted by the union mask, and clarifies the interpretation of our robustness tests with and without these masks.
Other Images in This Article
Show More
Copyright and Terms & Conditions
© 2026. The Author(s). Published by the American Astronomical Society.