Image Details
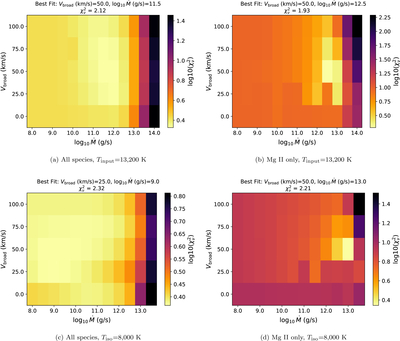
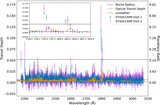
Caption: Figure 8.
χ2/N grids of the mass-loss rate (﹩{\mathrm{log}}_{10}\dot{M}﹩) vs. the broadening velocity (Vbroad) for the two-visit combined dataset. The left plot shows the models with all species included, fit to the whole wavelength range. The right plot shows the Mg II-only model fit to the data between 2783 and 2818 Å.
Other Images in This Article
Show More
Copyright and Terms & Conditions
© 2026. The Author(s). Published by the American Astronomical Society.
Copyright ©
2026 Astronomy Image Explorer. All Rights Reserved.