Image Details
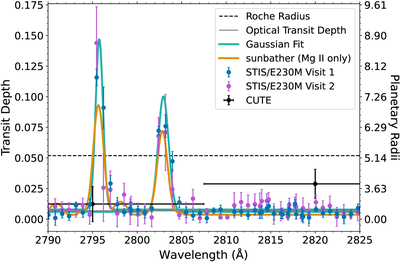
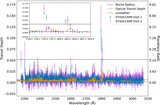
Caption: Figure 10.
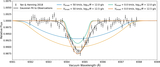
Best-fit model spectrum (gold, T = 13,200 K, ﹩\dot{M}\,=\,1{0}^{12.5}﹩ g s−1, Vbroad = 50 km s−1) to the 100 data points closest to the Mg II doublet from visit 1 (blue) and 2 (purple). A Gaussian fit to the Mg II is shown in green. Also plotted are the observations of KELT-9b from CUTE (black and gray, Visits 1 and 2, respectively, A. Egan et al. 2024). The HST/STIS observations are consistent with the CUTE observations when binned to the same wavelength scale.
Other Images in This Article
Show More
Copyright and Terms & Conditions
© 2026. The Author(s). Published by the American Astronomical Society.
Copyright ©
2026 Astronomy Image Explorer. All Rights Reserved.