Image Details
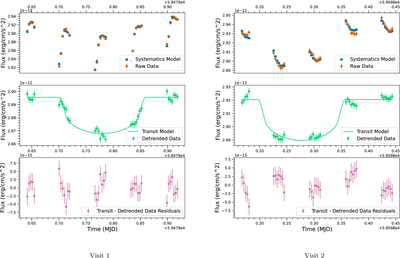
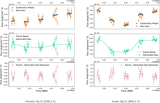
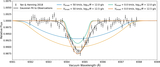
Caption: Figure 3.
Top: raw STIS/E230M white-light curve for KELT-9b for Visit 1 (left) and Visit 2 (right) with the fitted systematics model. Middle: systematics-subtracted light curve, fitted to the detrended data. Bottom: residuals between the detrended data and the transit model. For the first visit, we find a standard deviation of about 0.98% of the data, while for the second visit, we find residual scatter of about 0.38%.
Other Images in This Article
Show More
Copyright and Terms & Conditions
© 2026. The Author(s). Published by the American Astronomical Society.
Copyright ©
2026 Astronomy Image Explorer. All Rights Reserved.