Image Details
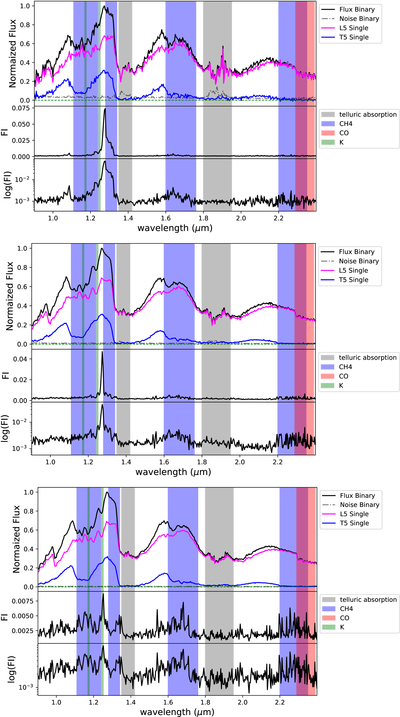
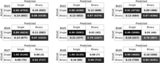
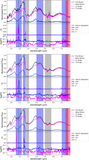
Caption: Figure 8.
FI for the BId1 model for low- (top), mid- (middle), and high-S/N (bottom) groups. Each panel displays FI on linear (middle plot) and logarithmic scales (bottom plot), compared to an example of an L5 plus T5 binary spectrum with an S/N in the associated range (top plot). Regions associated with telluric (gray), K I (green), CH4 (blue), and CO (red) absorption are indicated by vertical bands.
Other Images in This Article
Show More
Copyright and Terms & Conditions
© 2026. The Author(s). Published by the American Astronomical Society.
Copyright ©
2026 Astronomy Image Explorer. All Rights Reserved.