Image Details
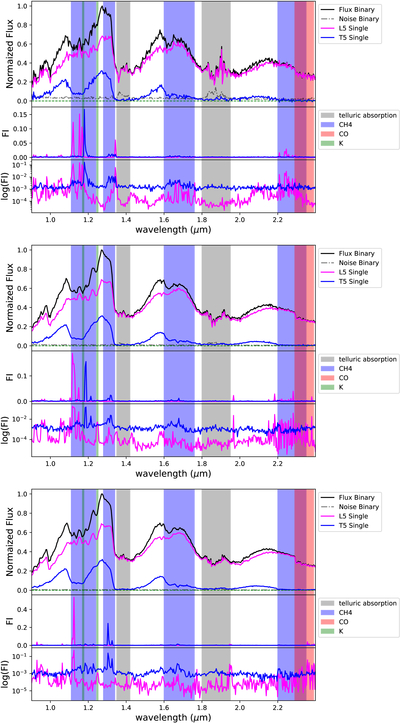
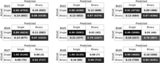
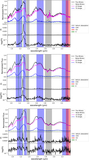
Caption: Figure 10.
FI for the BClass1 model for low- (top), mid- (middle), and high-S/N (bottom) groups (see Figure 8). Each panel displays FI for primary (magenta) and secondary (blue) classification on linear (middle plot) and logarithmic scales (bottom plot), compared to an L5 plus T5 synthetic binary spectrum with an S/N in the associated range (top plot). Regions associated with telluric (gray), K I (green), CH4 (blue), and CO (red) absorption are indicated by vertical bands.
Other Images in This Article
Show More
Copyright and Terms & Conditions
© 2026. The Author(s). Published by the American Astronomical Society.
Copyright ©
2026 Astronomy Image Explorer. All Rights Reserved.