Image Details
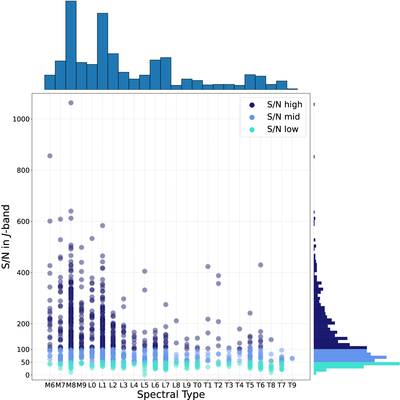
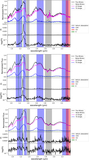
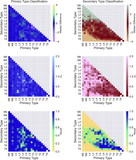
Caption: Figure 1.
J-band S/N vs. spectral type of our empirical spectral sample. Each individual spectrum is plotted and color coded by its assignment to low- (S/N < 50, light blue), mid- (50 ≤ S/N < 100, medium blue), and high-S/N (S/N ≥ 100, dark blue) groups. We show the marginalized distributions of the spectral type along the top axis, and for S/N along the right axis.
Other Images in This Article
Show More
Copyright and Terms & Conditions
© 2026. The Author(s). Published by the American Astronomical Society.
Copyright ©
2026 Astronomy Image Explorer. All Rights Reserved.