Image Details
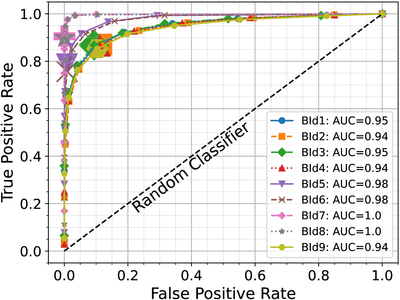
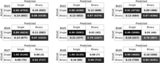
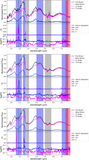
Caption: Figure 4.
ROC curves for the nine binary identification (BId) models examined in this study, comparing the true positive rate (true binaries) to the false positive rate (singles identified as binaries) as a function of the detection threshold. The threshold for binary identification, computed as the fraction of decision trees identifying a spectrum as binary, was allowed to vary from 0 to 1. Random selection would follow the dashed line, while the computed curves indicate high fidelity in identifying true binaries. The legend indicates the color, point style, and line style corresponding to the given BId model, and lists the AUC metric for each model. Larger symbols correspond to a detection threshold of 0.5, corresponding to a majority vote.
Other Images in This Article
Show More
Copyright and Terms & Conditions
© 2026. The Author(s). Published by the American Astronomical Society.