Image Details
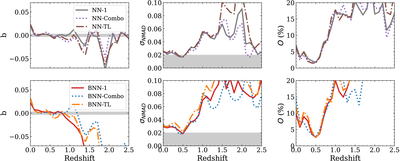
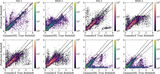
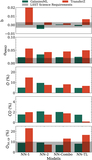
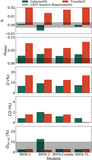
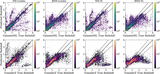
Caption: Figure 15.
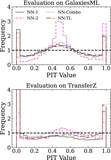
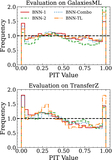
Photo-z performance on bias (left column), scatter (middle column), and outlier rate (right column) for equally spaced redshift bins (δz = 0.01) up to z < 2.5 for the NNs (top row) and BNNs (bottom row) evaluated on the GalaxiesML test set. The gray shaded areas correspond to the LSST science goals. Regardless of the training methodology, the models perform similarly across this redshift range.
Other Images in This Article
Show More
Copyright and Terms & Conditions
© 2026. The Author(s). Published by the American Astronomical Society.
Copyright ©
2026 Astronomy Image Explorer. All Rights Reserved.