Image Details
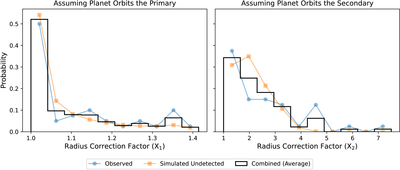
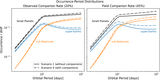
Caption: Figure 4.
The probability distribution of planet radius correction factors from our Kepler control sample, assuming planets orbit left: the primary or right: the second-brightest star. Blue circles represent the distribution measured from the observed companions, orange squares represent the distribution measured from the simulated, undetected companions, while the black histogram represents a blend of those two distributions averaged in each bin.
Other Images in This Article
Copyright and Terms & Conditions
© 2026. The Author(s). Published by the American Astronomical Society.
Copyright ©
2026 Astronomy Image Explorer. All Rights Reserved.