Image Details
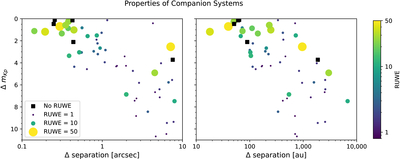
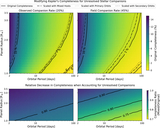
Caption: Figure 3.
Imaged companions in our Kepler control sample, showing magnitude differences in the Kepler band as functions of projected (left) on-sky or (right) physical separations (measured with respect to the primary). Circle markers are colored and sized by the RUWE values of the primary star; black square markers indicate systems that did not have RUWE values available in Gaia DR3. The cutoff for on-sky separations to be included in our sample was roughly twice the Kepler pixel size (∼8″).
Other Images in This Article
Copyright and Terms & Conditions
© 2026. The Author(s). Published by the American Astronomical Society.
Copyright ©
2026 Astronomy Image Explorer. All Rights Reserved.