Image Details
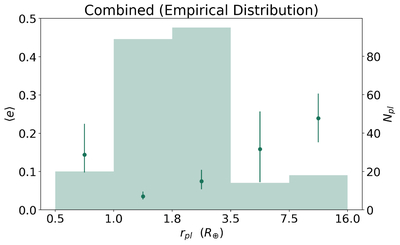
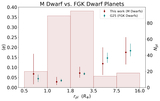
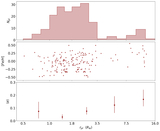
Caption: Figure 13.
Same as Figure 2, but where 〈e〉 is calculated using the empirical eccentricity model rather than the beta distribution. The error bars represent the 16th and 84th percentiles of 〈e〉. The green histogram represents the number of M dwarf planets in each radius bin (right-hand vertical axis).
Other Images in This Article
Show More
Copyright and Terms & Conditions
© 2026. The Author(s). Published by the American Astronomical Society.
Copyright ©
2026 Astronomy Image Explorer. All Rights Reserved.