Image Details
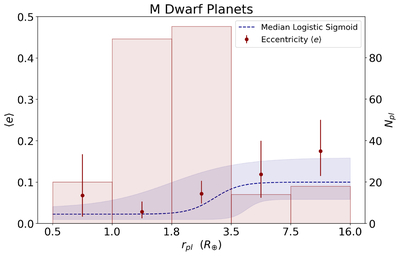
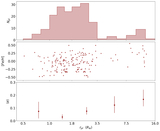
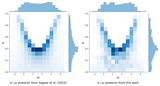
Caption: Figure 2.
〈e〉 vs. planet radius bins for the sample of M dwarf planets (red points). The red error bars present the 16th and 84th percentiles of 〈e〉. The red histogram represents the number of M dwarf planets in each radius bin (right-hand vertical axis). The median logistic sigmoid model is plotted in dark blue. The 16th and 84th percentiles of the logistic sigmoid are denoted by the dark blue shaded regions.
Other Images in This Article
Show More
Copyright and Terms & Conditions
© 2026. The Author(s). Published by the American Astronomical Society.
Copyright ©
2026 Astronomy Image Explorer. All Rights Reserved.