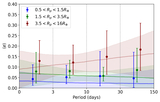
Image Details
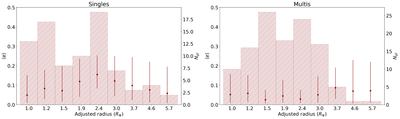
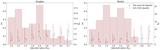
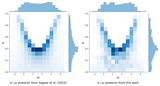
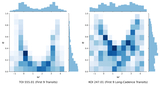
Caption: Figure 3.
Left: 〈e〉 vs. adjusted planet radius radj bin centers for singles with 0.5 < radj < 5.1R⊕ (red points). The red error bars present the 16th and 84th percentiles of 〈e〉. The red histogram represents the number of M dwarf planets in each bin (right-hand vertical axis). Right: same as the left panel, but for multis.
Other Images in This Article
Show More
Copyright and Terms & Conditions
© 2026. The Author(s). Published by the American Astronomical Society.
Copyright ©
2026 Astronomy Image Explorer. All Rights Reserved.