Image Details
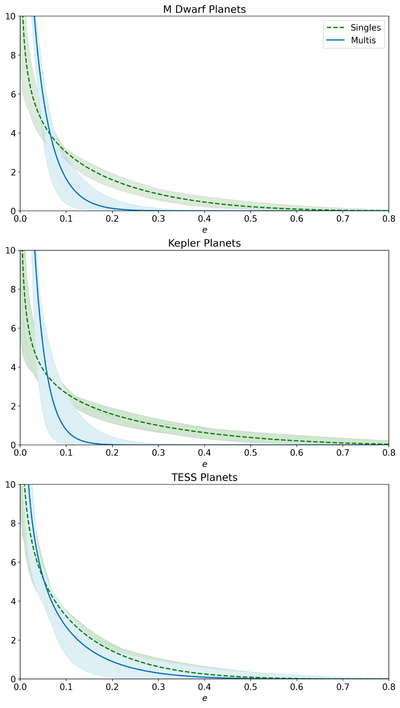
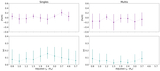
Caption: Figure 1.
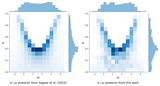
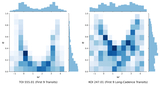
Top: best-fit parent eccentricity distributions for the entire sample of singles (green) and multis (blue) in this work. Middle: best-fit parent eccentricity distributions for singles and multis for the sample of M dwarf KOIs in this work. The best-fit distributions for both populations are distinct, as shown in S23. Bottom: same as the left panel, but for the sample of TOIs in this work. The difference in parent distributions for singles and multis is less apparent for TOIs, likely due to factors associated with the TESS observation strategy leading to higher levels of “contamination” in the singles population by true multiplanet systems.
Other Images in This Article
Show More
Copyright and Terms & Conditions
© 2026. The Author(s). Published by the American Astronomical Society.