Image Details
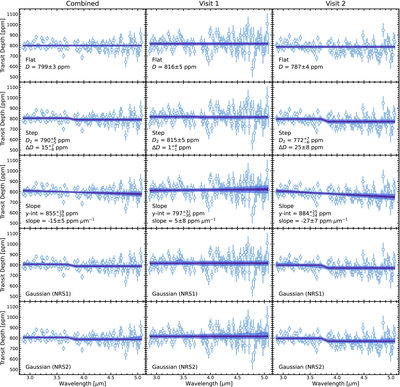
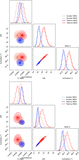
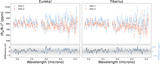
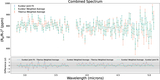
Caption: Figure 11.
Nonphysical model fits to the combined (left), visit 1 (middle), and visit 2 (right) Eureka! data reductions for the (top to bottom) flat, step function, slope, and NRS1 and NRS2 Gaussian models, respectively. For each panel, the data are given by the points, the 1σ bounds of the best-fit models are given by the inner, darker bands, and the 3σ bounds are given by the outer, lighter bands. For the flat, step function, and slope models the best-fit parameter values and associated uncertainties are given in the figure, where D is the average transit depth across both detectors, D2 is the average NRS2 transit depth, and ΔD is the offset between the NRS1 and NRS2 detectors; those of the Gaussian models are given in Table 5.
Other Images in This Article
Show More
Copyright and Terms & Conditions
© 2026. The Author(s). Published by the American Astronomical Society.