Image Details
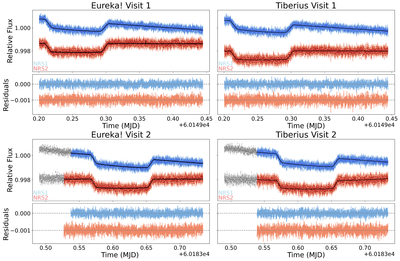
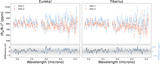
Caption: Figure 2.
White light curves and residuals from the Eureka! (left column) and Tiberius (right column) reductions for visit 1 (top row) and visit 2 (bottom row) of HD 15337 c (in blue for NRS1 and red for NRS2). The gray points in the bottom panels are the trimmed data points from the second visit of the Eureka! and Tiberius reductions, which do not have inflated errors and are not considered in the fitting.
Other Images in This Article
Show More
Copyright and Terms & Conditions
© 2026. The Author(s). Published by the American Astronomical Society.
Copyright ©
2026 Astronomy Image Explorer. All Rights Reserved.