Image Details
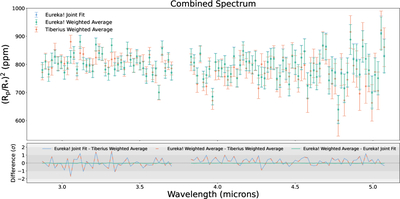
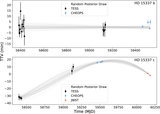
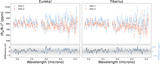
Caption: Figure 9.
Combined spectra for the two visits of HD 15337 c. We show the error-weighted average for the Tiberius reduction, and both the jointly fit spectrum and error-weighted average spectrum for the Eureka! reduction. All three versions of the combined spectrum are in good agreement, with the median difference between the Tiberius reduction and Eureka! joint fit of ∼17 ppm and a maximum difference of ∼1.49σ.
Other Images in This Article
Show More
Copyright and Terms & Conditions
© 2026. The Author(s). Published by the American Astronomical Society.
Copyright ©
2026 Astronomy Image Explorer. All Rights Reserved.