Image Details
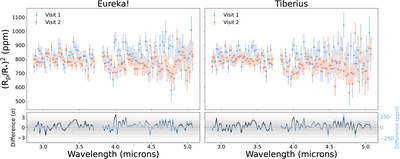
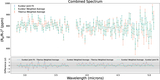
Caption: Figure 8.
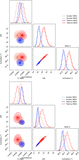
Spectra for both visits for each of the Eureka! (left) and Tiberius (right) reductions. We show the differences between the two visits within a reduction pipeline on the bottom panels in units of σ (black) and ppm (blue). While there are some differences between the visits, the points generally agree, with median differences of <1σ. Only two points in the Eureka! spectra and one point in the Tiberius spectra deviate by more than 3σ between visits.
Other Images in This Article
Show More
Copyright and Terms & Conditions
© 2026. The Author(s). Published by the American Astronomical Society.
Copyright ©
2026 Astronomy Image Explorer. All Rights Reserved.