Image Details
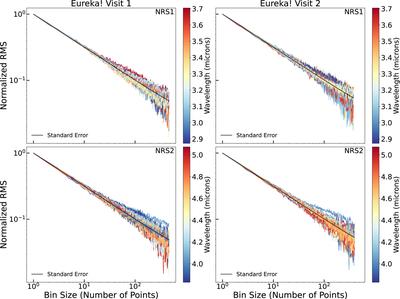
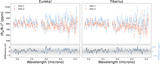
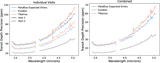
Caption: Figure 6.
The plots of normalized rms vs. bin size for both detectors for both visits are shown for the Eureka! reduction colored by wavelength. The bins generally follow the black lines, which represent the standard error, and show that the residual noise seen in the white light curves (Figure 3) is not as evident in the individual spectroscopic bins, likely due to the larger noise in the bins.
Other Images in This Article
Show More
Copyright and Terms & Conditions
© 2026. The Author(s). Published by the American Astronomical Society.
Copyright ©
2026 Astronomy Image Explorer. All Rights Reserved.