Image Details
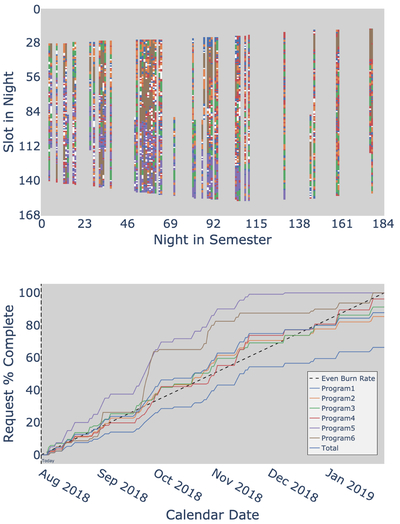
Caption: Figure 5.
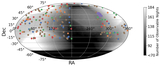
Top: bird’s-eye view of the optimal semester schedule described in Section 4.2. The plot is analogous to Figure 1, with visits that are color-coded by program (key in bottom panel). Some slots are not filled despite this being the optimal solution. This is due to stars with infeasible requests due to challenging R.A.s. Bottom: the COF. Each line shows the program completion over time. We comment on the dispersion in forecasted completion in Section 4.2.
Other Images in This Article
Copyright and Terms & Conditions
© 2026. The Author(s). Published by the American Astronomical Society.
Copyright ©
2026 Astronomy Image Explorer. All Rights Reserved.