Image Details
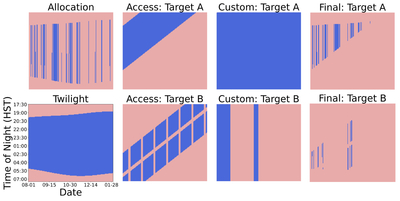
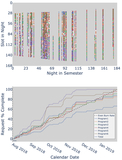
Caption: Figure 2.
Construction of two accessibility maps. Each panel is analogous to Figure 1 and shares the same limits. The left column shows the allocation and twilight maps drawn from the Keck 2018B semester (see Section 4.2), which are the same for both requests. The two requests have different coordinates and thus different accessibility maps. For Target A, the upward tilt of the blue band indicates progressively later rise/set times over a semester. For Target B, the vertical stripes are due to Moon “collisions” and the diagonal exclusion region is due to zenith crossing events. Target A has no custom accessibility constraints, while Target B is restricted to a range of dates. The right column shows the final maps Ar, which are the intersection of all constituent maps. Each request’s final accessibility set ﹩{{ \mathcal A }}_{r}﹩ consists of the blue (d, s) pairs.
Other Images in This Article
Copyright and Terms & Conditions
© 2026. The Author(s). Published by the American Astronomical Society.