Image Details
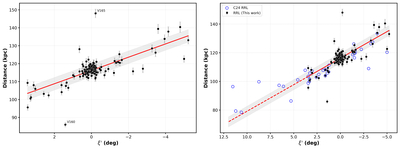
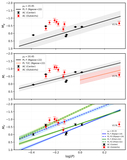
Caption: Figure 8.
Left: distance to the RRLSs along the stream as defined by the line in Figure 6 (right panel). The red line is the best fit to the data excluding the likely outlier at ﹩({\xi }^{{\prime} },d)=(1\mathop{.}\limits^{^\circ }4,\,86\,{\rm{kpc}})﹩ (see text). Right: same as the left panel, but expanding toward larger angular distances in the “near” tail to include the stars detected by P. S. Coppi et al. (2024; an offset of −2.78 kpc was applied to those stars to match our distance scale). The dashed red portion of the line is the extrapolation of our fitted gradient toward larger ﹩{\xi }^{{\prime} }﹩.
Other Images in This Article


Copyright and Terms & Conditions
© 2026. The Author(s). Published by the American Astronomical Society.
Copyright ©
2026 Astronomy Image Explorer. All Rights Reserved.