Image Details
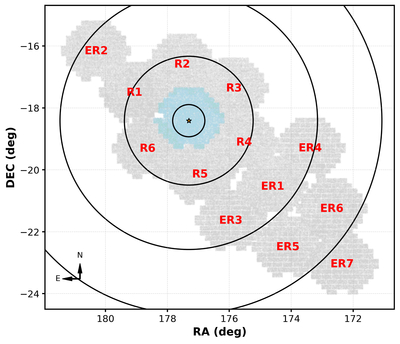
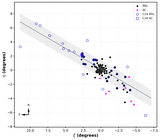
Caption: Figure 1.
Spatial coverage of our DECam observations of CraII in equatorial coordinates. The gray background, which shows the footprint of our survey, is a density map made with all stars in our catalog. The central region, in blue, shows the single field observed in V20. Black ellipses indicate 1rh, 4rh, 8rh, and 12rh. The orange star marks the center of CraII.
Other Images in This Article


Copyright and Terms & Conditions
© 2026. The Author(s). Published by the American Astronomical Society.
Copyright ©
2026 Astronomy Image Explorer. All Rights Reserved.