Image Details
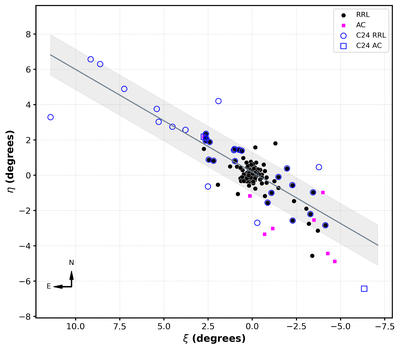
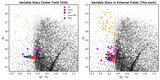
Caption: Figure 6.
Spatial distribution of the RRLSs and AC stars in planar coordinates with the center of CraII at (ξ, η) = (0, 0). Coordinate ξ increases toward the east (to the left in this plot). Stars from V20 and this work are shown as black solid circles (RRLSs, all types) and magenta squares (AC stars). Stars in the tails of CraII identified in the La Silla–QUEST survey by P. S. Coppi et al. (2024, their Table 2) are shown as open blue circles (RRLSs, all types) and blue open squares (AC stars). The solid line and gray region show the best linear regression and its 1σ error, respectively, of the RRLSs in the outskirts (not including the central field).
Other Images in This Article


Copyright and Terms & Conditions
© 2026. The Author(s). Published by the American Astronomical Society.