Image Details
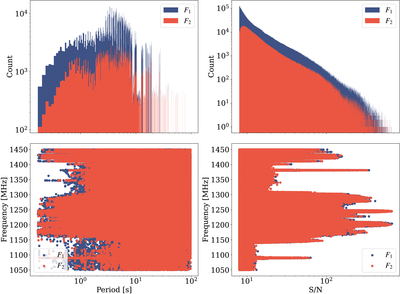
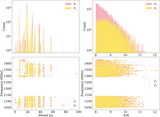
Caption: Figure 7.
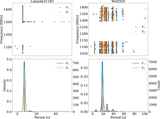
Statistical distribution of F1 (blue) and F2 (red) in the search. Top left: histogram of the candidate periods. Top right: histogram of the signal-to-noise ratio of the candidates. Bottom left: scatter of candidates in the ν–P plane. Bottom right: scatter of candidates in the ν–S/N plane.
Other Images in This Article
Show More
Copyright and Terms & Conditions
© 2026. The Author(s). Published by the American Astronomical Society.
Copyright ©
2026 Astronomy Image Explorer. All Rights Reserved.