Image Details
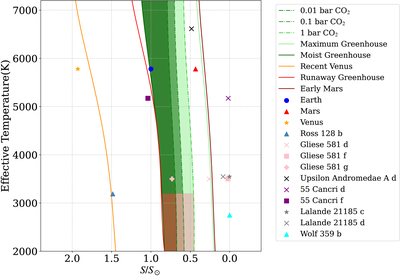
Caption: Figure 2.
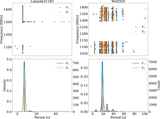
Various HZ boundaries for stars with different effective temperatures. The five solid lines are the HZ boundaries determined by the stellar flux HZ model of R. K. Kopparapu et al. (2013), and the green and brown shaded regions are the HZCL model of E. W. Schwieterman et al. (2019) assuming limiting CO2 pressures of 0.01 bar (dark green), 0.1 bar (lighter green), and 1 bar (lightest green). The brown contours denote regions around low-temperature stars where photochemical effects could allow CO concentrations to exceed short-term human safety thresholds (>100 ppm) at the moist greenhouse boundary, under an assumed surface flux of 3 × 10¹¹ molecules cm−2 s−1. The planetary parameters are from R. Basant et al. (2025) for Barnard’s star, F. Liebing et al. (2024) for Ross 128, A. von Stauffenberg et al. (2024) and S. S. Vogt et al. (2010) for Gliese 581, R. Ligi et al. (2012) for Upsilon Andromedae A, R. I. Dawson & D. C. Fabrycky (2010), J. N. Winn et al. (2011) and V. Bourrier et al. (2018) for 55 Cancri A, S. A. Hurt et al. (2022) for Lalande 21185, and M. Tuomi et al. (2019) and R. Bowens-Rubin et al. (2023) for Wolf 359.
Other Images in This Article
Show More
Copyright and Terms & Conditions
© 2026. The Author(s). Published by the American Astronomical Society.