Image Details
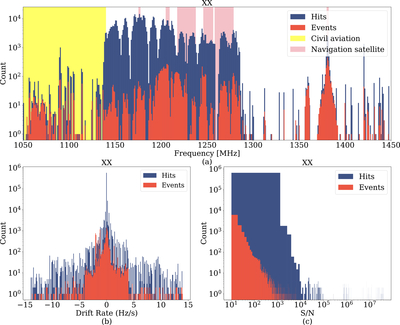
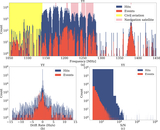
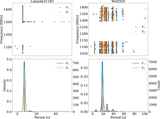
Caption: Figure 4.
Histograms of the distributions of frequency, drift rate, and signal-to-noise ratio in the XX channel. The frequency bands of some known interference sources are displayed on the frequency panel.
Other Images in This Article
Show More
Copyright and Terms & Conditions
© 2026. The Author(s). Published by the American Astronomical Society.
Copyright ©
2026 Astronomy Image Explorer. All Rights Reserved.