Image Details
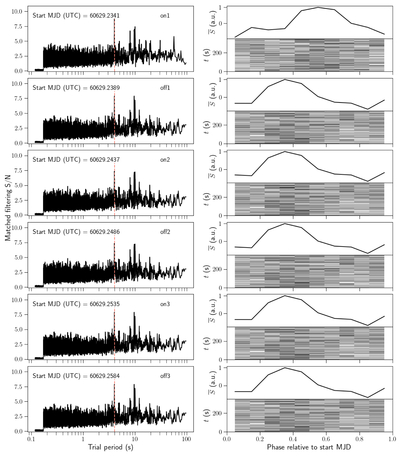
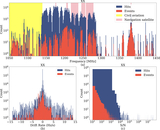
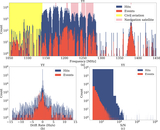
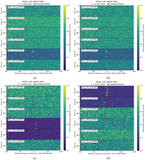
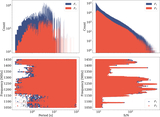
Caption: Figure 9.
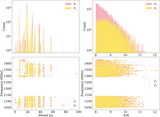
Plot for the candidate in the 1089.111328 MHz channel during the observation of Barnard’s star. Left panels are the periodograms generated from the time series. Right panels show the phase–time diagrams (bottom subplots) and folded profiles (top subplots) of candidates at P = 4.00106 s. The peak of the periodogram and the folded profile are detected in the first on-source scan.
Other Images in This Article
Show More
Copyright and Terms & Conditions
© 2026. The Author(s). Published by the American Astronomical Society.
Copyright ©
2026 Astronomy Image Explorer. All Rights Reserved.